The World Dataviz Prize 2023
Visualizing government metrics that can be used to drive and measure progress.
Conducted by Informationisbeautiful.net in partnership with the World Government Summit, the competition focused on the past, present and future of society and governments.
This entry received an honorable mention in the static poster category, out of hundreds of submissions.
Approach
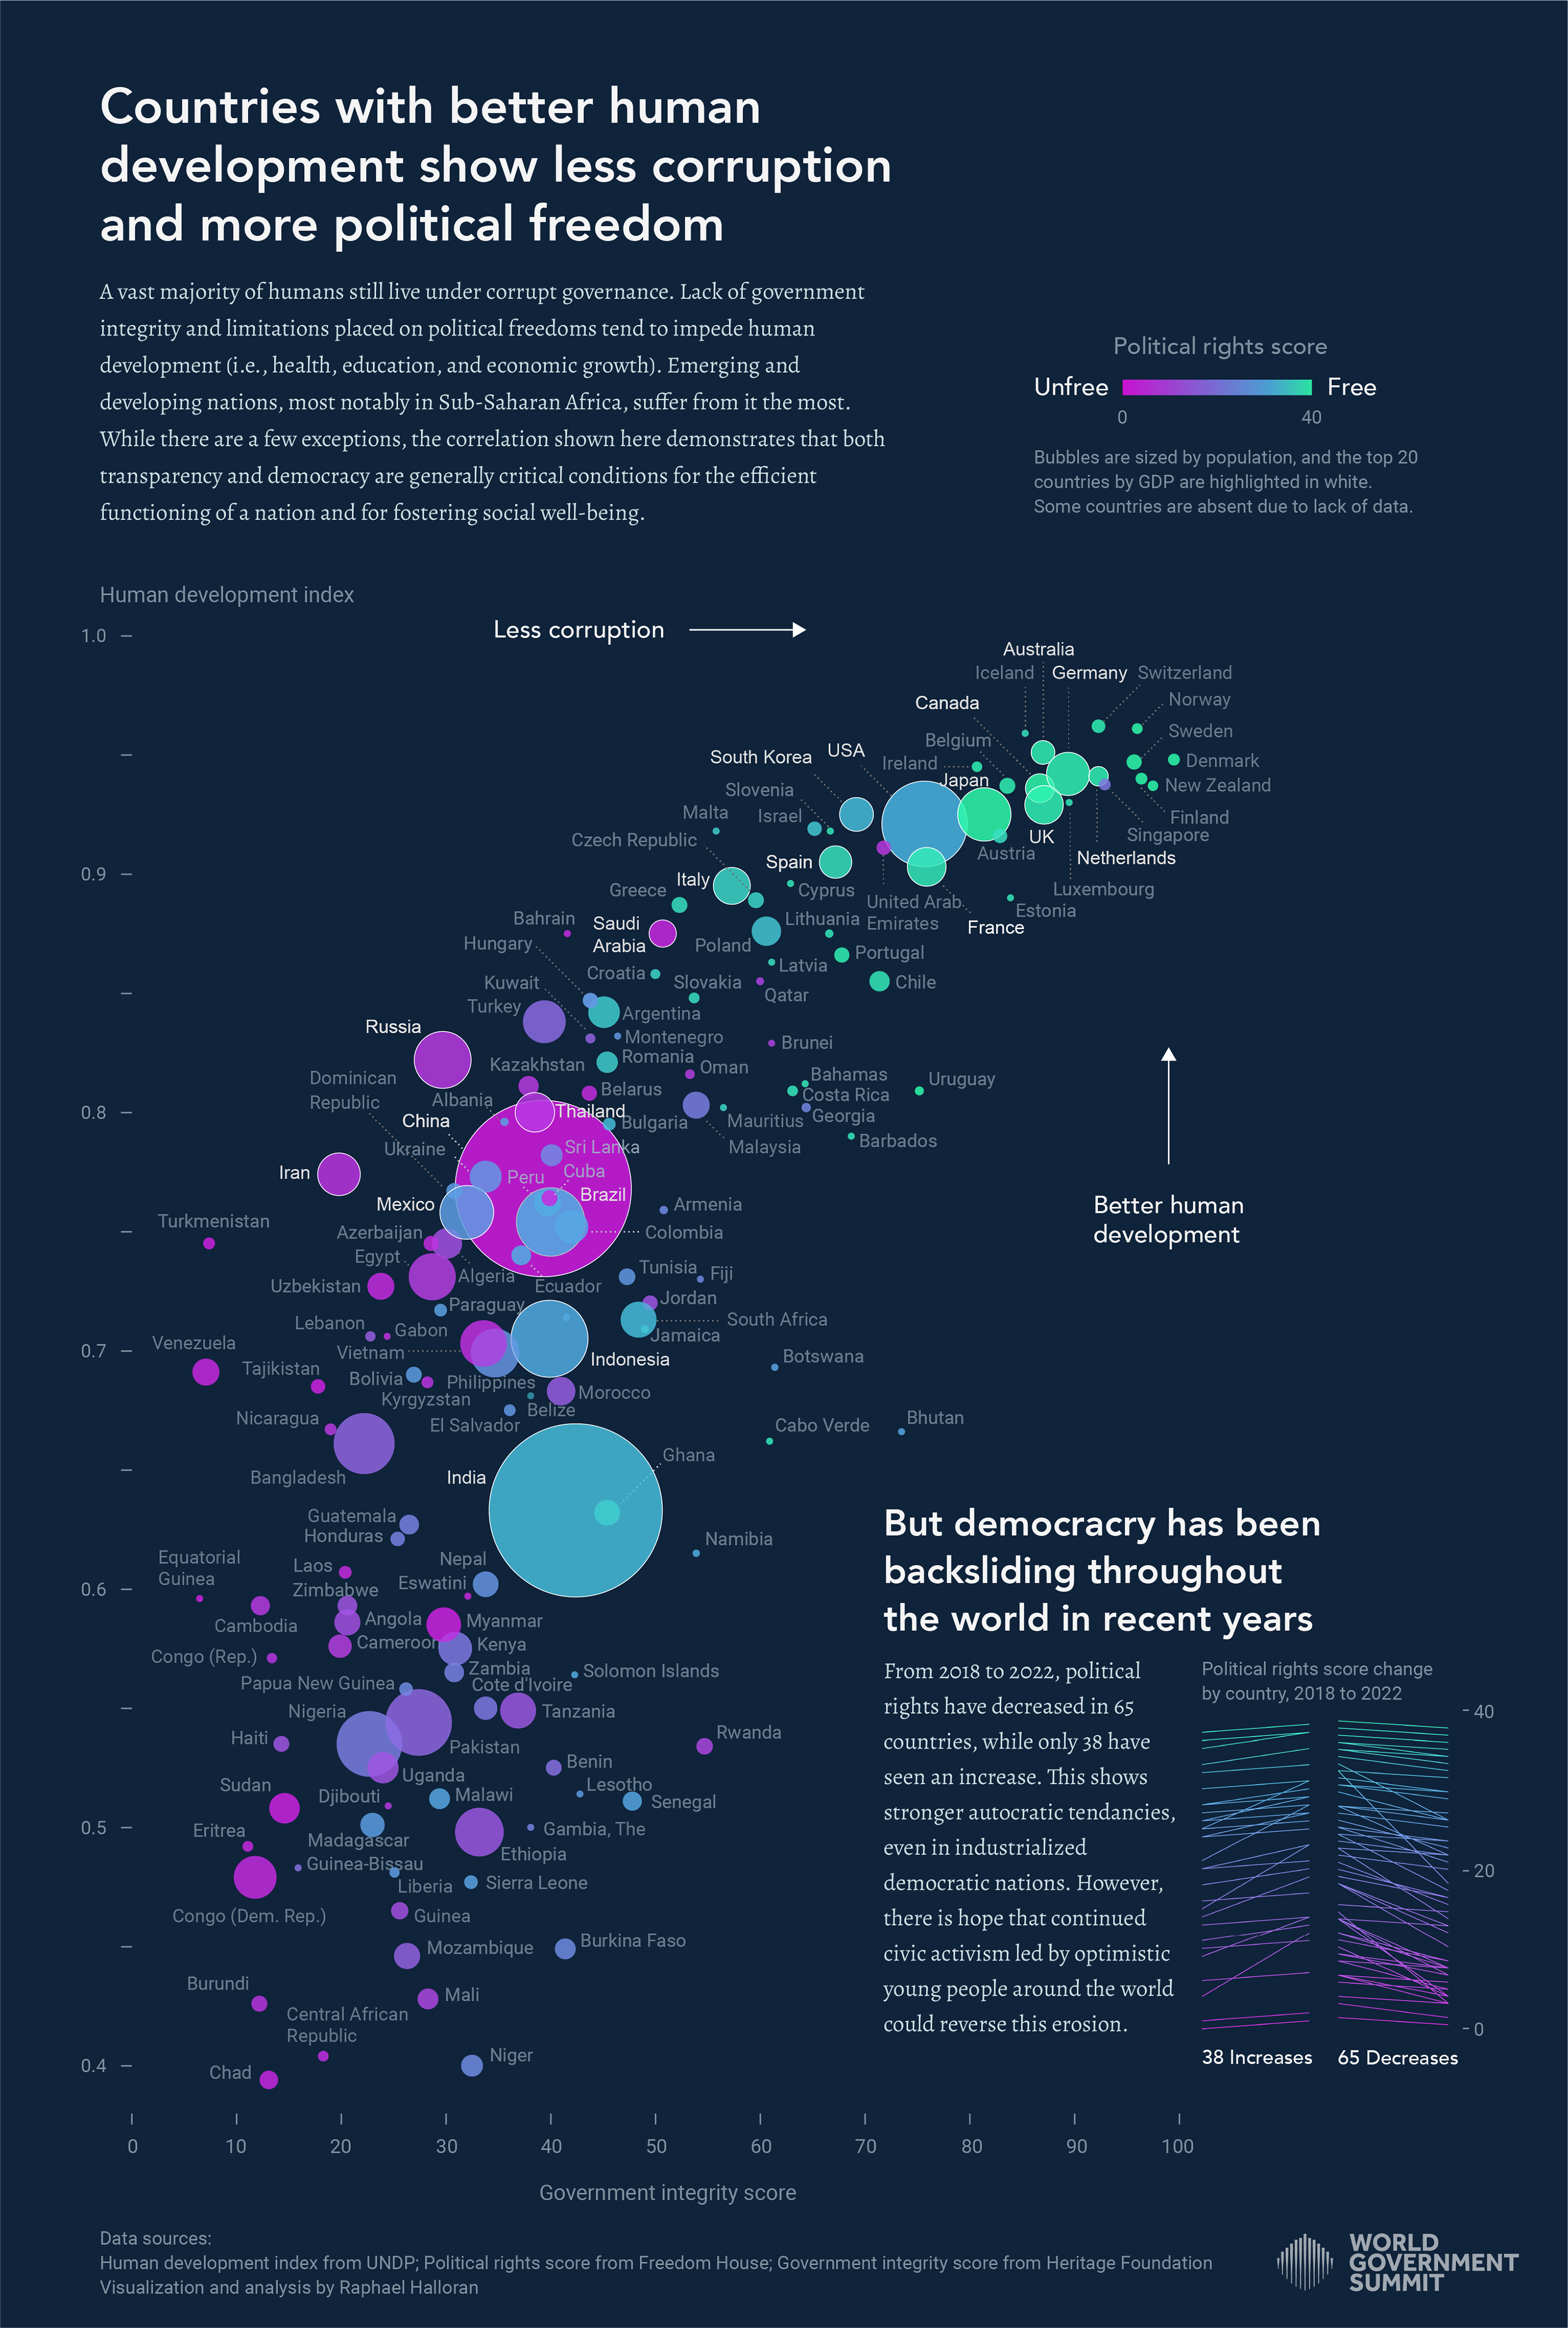
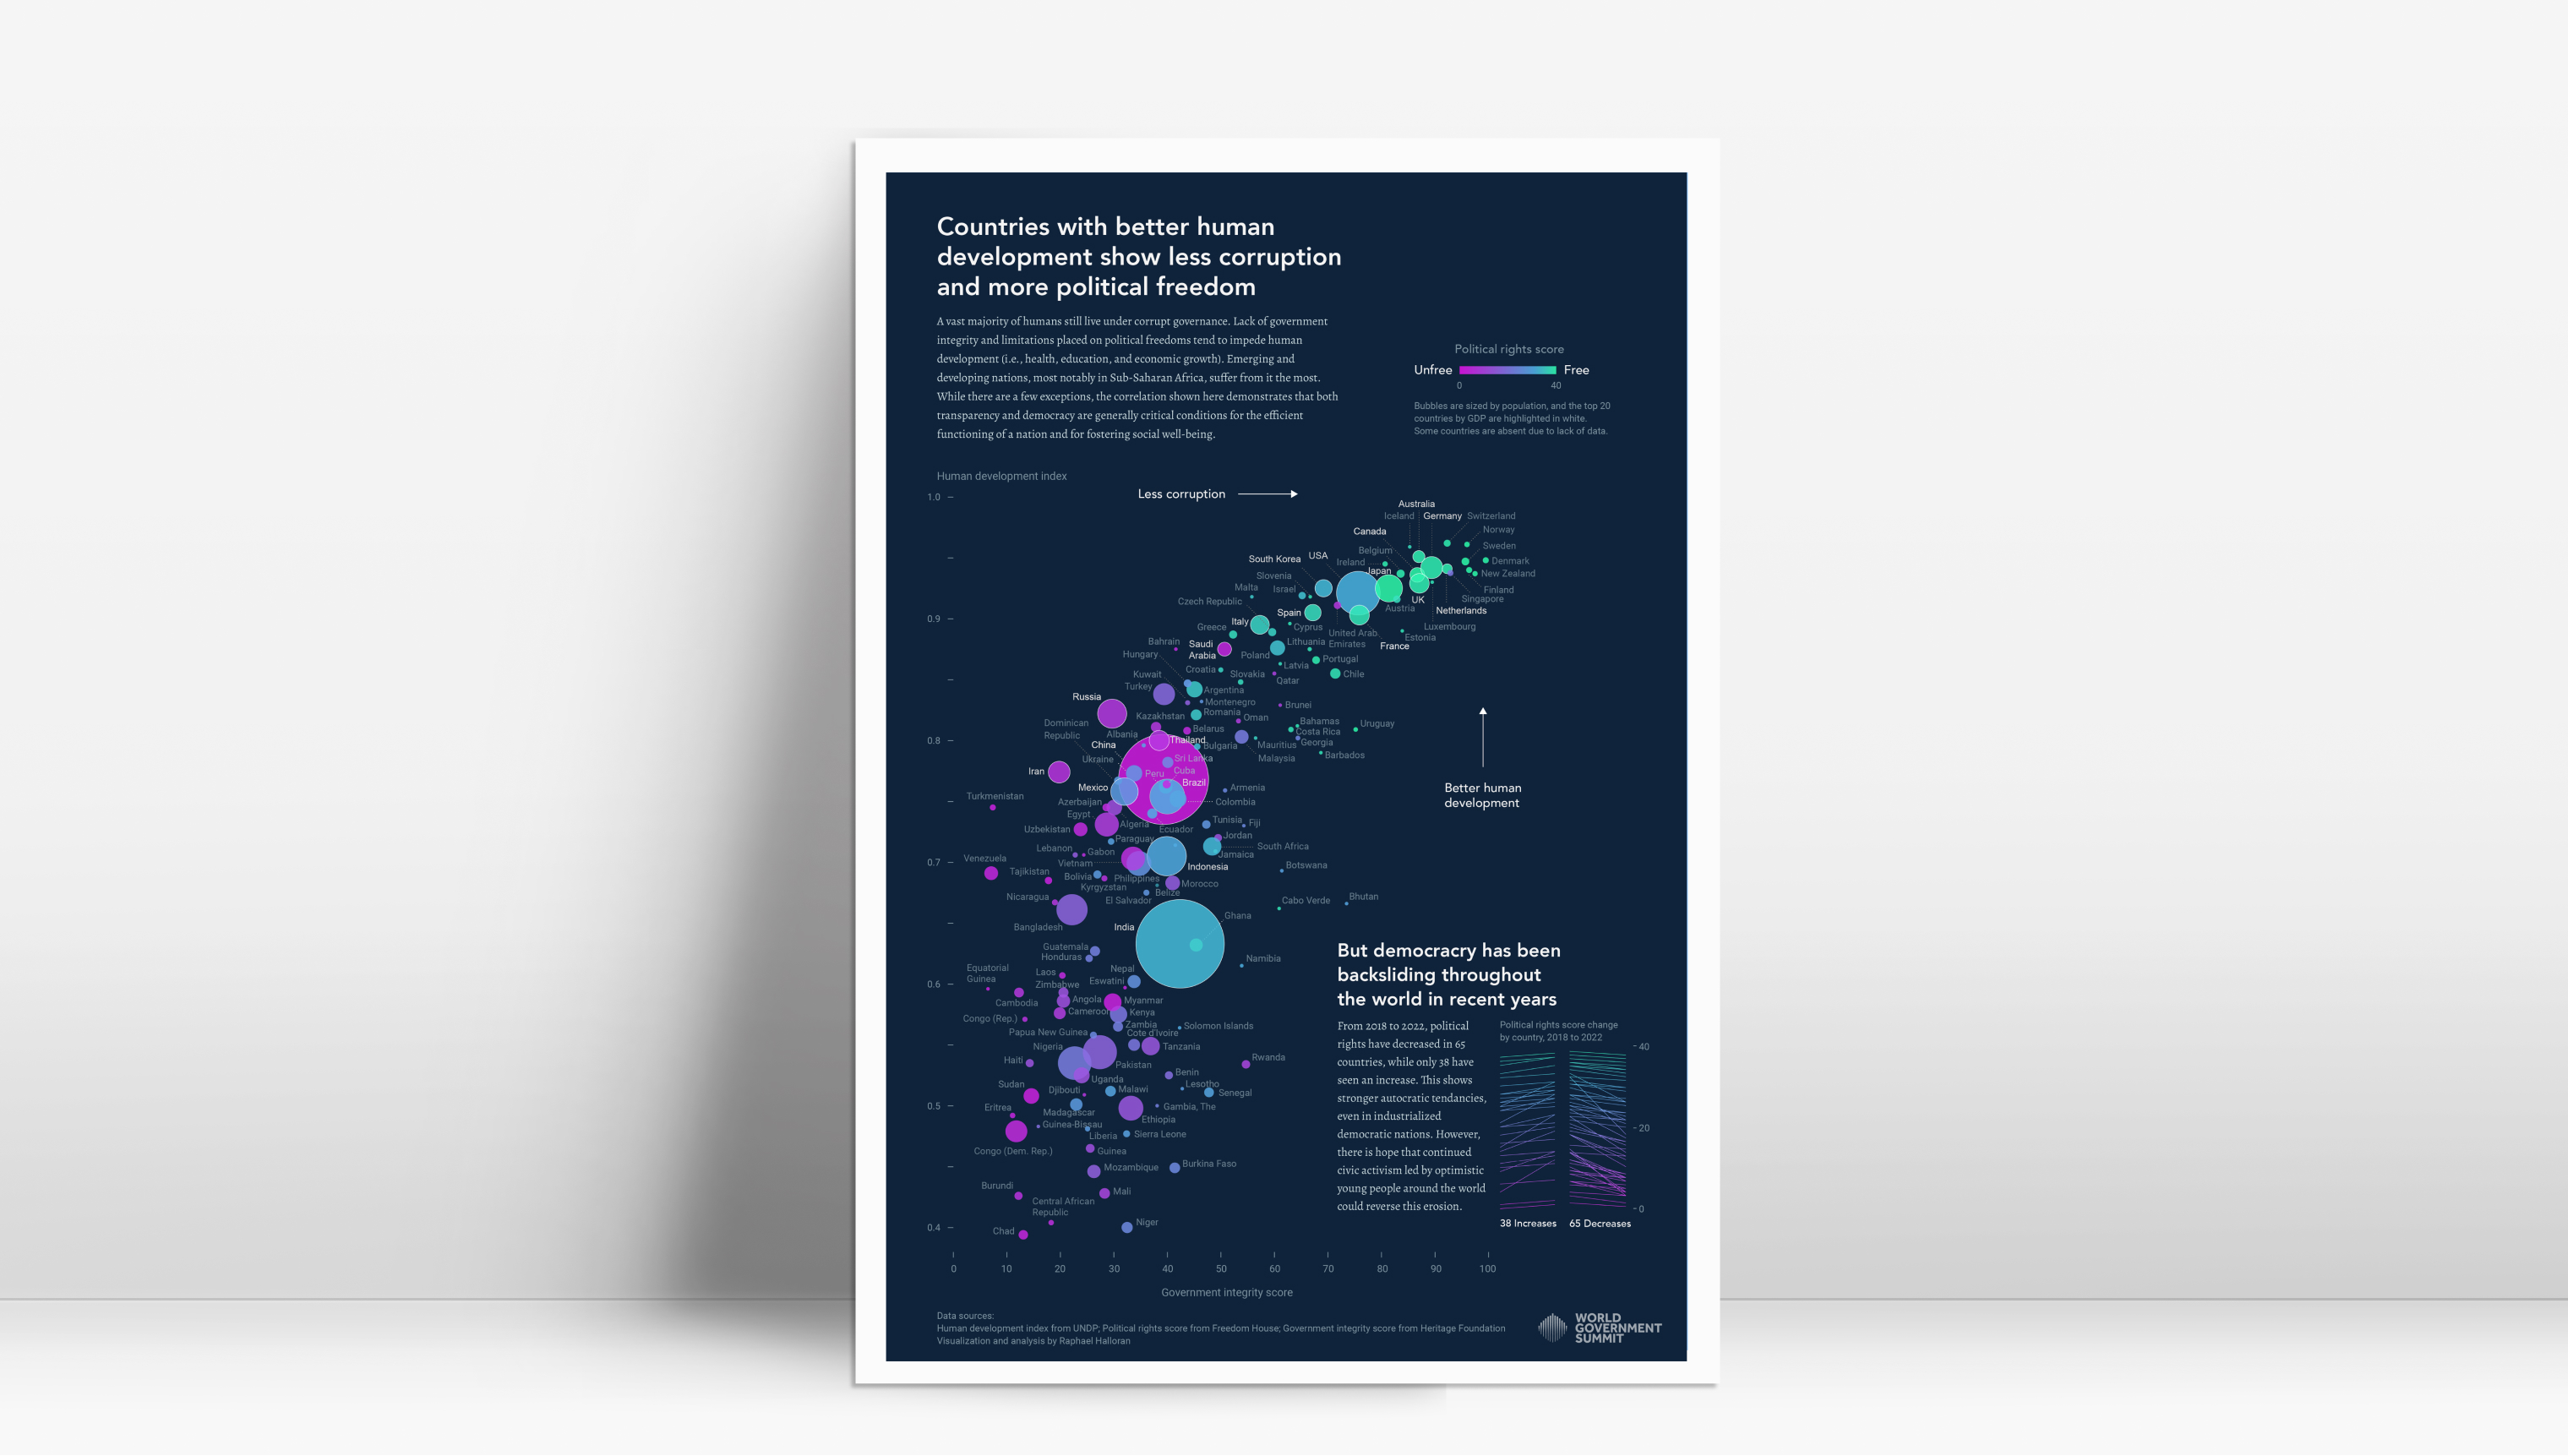
This visualization examines the interplay between transparency, human development, and political rights in government, showing how different countries stack up against each other.
To create this visualization, I leveraged Flourish and Google Sheets to analyze the data and uncover meaningful patterns and trends. Finally, I crafted the design using Adobe Illustrator, incorporating various visual attributes to effectively communicate the data and create a data-rich view.
By presenting the information in a clear and concise manner, this visualization aims to shed light on the relationship between these key factors and how they impact government progress.
